As businesses strive to understand their customers better, the importance of tracking customer satisfaction and loyalty has never been higher. One of the most effective tools for this purpose is the NPS question format, which helps companies gauge how likely customers are to recommend their products or services. However, merely collecting this data is not enough. Businesses need to interpret it correctly and respond accordingly. This is where flexible dashboards come into play. With customizable dashboards, businesses can visualize NPS data in a way that makes it actionable. In this blog post, we will explore the challenges associated with these tools and offer actionable solutions to ensure they are used to their full potential.
What Is the NPS Question Format?
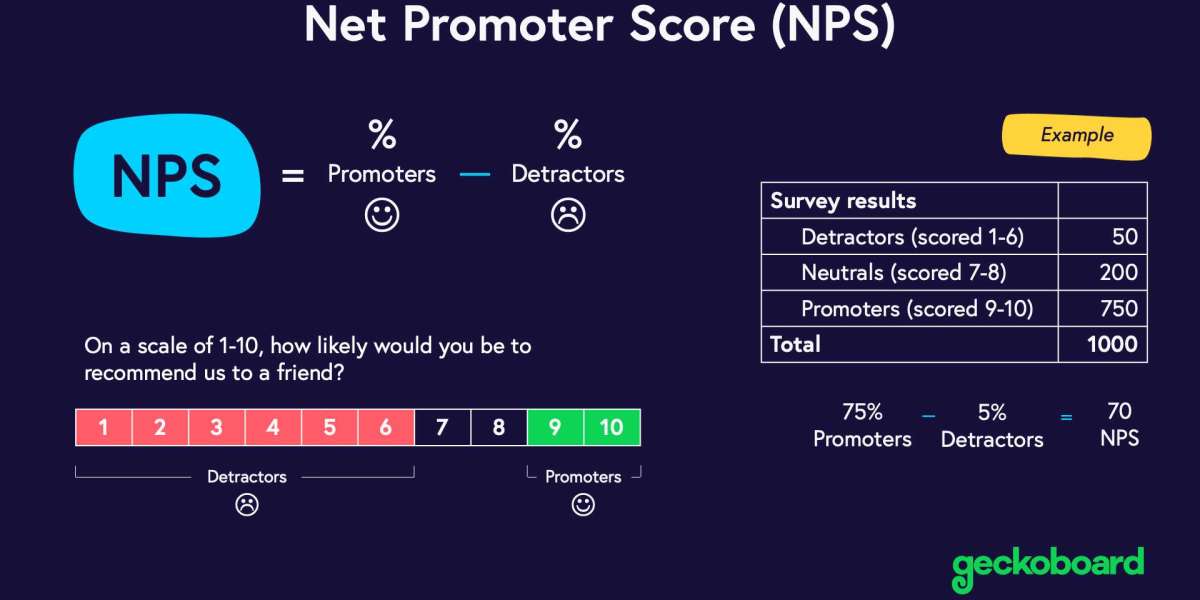
The NPS question format typically revolves around a simple question: “On a scale of 0-10, how likely are you to recommend our product/service to a friend or colleague?” Based on the response, customers are categorized into promoters, passives, or detractors. This feedback is a powerful tool in measuring customer loyalty, as studies have shown that businesses with high NPS scores are more likely to grow. According to a Bain & Company study, companies with high NPS scores grew at more than twice the rate of their competitors.
Challenge 1: Crafting the Right NPS Question
While the classic NPS question is simple, crafting the right question that resonates with your audience is crucial for obtaining valuable feedback. If the question isn't clear or relevant to the customer’s experience, the responses will not provide useful insights.
Solution: Tailor the NPS question format to reflect your business's specific context. For instance, instead of just asking, "How likely are you to recommend us?" consider adding follow-up questions that dive deeper into particular aspects of the service or product.
Example: A local fitness studio in Los Angeles personalizes their NPS question by adding, “How likely are you to recommend our yoga classes to a friend?” This allows them to gather more targeted feedback about a specific offering rather than a general service.
Challenge 2: Encouraging More Responses
Getting enough responses to ensure the reliability of your NPS data can be a challenge, especially for local businesses with smaller customer bases.
Solution: Make it easy for customers to provide feedback by integrating NPS surveys into multiple touchpoints, such as email, SMS, or through your app. Additionally, offering a small incentive, like a discount or a freebie, can encourage participation.
Example: A small bakery in Portland sends out NPS surveys via email to customers who made purchases in the last week. They offer a 10% discount on their next purchase for completing the survey, resulting in a 25% increase in response rates.
Challenge 3: Understanding NPS Categories
The categorization of responses into promoters, passives, and detractors is central to NPS question format analysis, but the real challenge is interpreting the data correctly. For instance, many businesses might only focus on detractors, ignoring valuable feedback from passives.
Solution: Don’t just focus on detractors; actively engage with promoters and passives. Promoters can help amplify your brand, while passives provide an opportunity for improvement.
Example: A local bookstore in San Francisco receives an NPS of 8-9 from many customers, placing them in the passive category. Instead of ignoring these responses, they follow up with a special loyalty offer to convert them into promoters, resulting in a higher overall score.
Challenge 4: Collecting Actionable Data
Even with a well-designed NPS survey, the data collected can be difficult to analyze, especially when it’s disconnected from other business metrics.
Solution: Use flexible dashboards to compile and visualize NPS data alongside other performance metrics, such as sales or customer retention. This allows for a more holistic understanding of customer sentiment.
Example: A local coffee chain in Miami uses a dashboard to track NPS scores, sales figures, and customer service interactions. This integrated view helps them identify specific areas for improvement, such as reducing wait times during peak hours.
Challenge 5: Responding to Real-Time Data
Real-time data is crucial when trying to adapt to changing customer preferences or fixing issues before they escalate. However, many businesses struggle with quickly acting on insights from their NPS data.
Solution: Implement a system that sends real-time alerts when a detractor or negative feedback is identified. This allows your team to take immediate action, such as offering solutions or addressing customer complaints.
Example: A local gym in Houston uses an automated system that sends an alert when a customer leaves a low NPS score. The team can respond immediately, offering a free class or a personal consultation to resolve the issue.
Challenge 6: Tracking NPS Over Time
While NPS question format results give valuable insight at a particular moment, tracking changes over time is critical for assessing the effectiveness of improvements.
Solution: Set up a recurring NPS survey to be sent to customers at regular intervals, such as quarterly or annually. Compare scores over time to see if your efforts are driving positive changes.
Example: A family-owned restaurant in Chicago sends an NPS survey every three months to measure their progress in improving customer service. Over a year, they see a steady increase in their score, largely attributed to improved waitstaff training.
Challenge 7: Designing Flexible Dashboards
Flexible dashboards are an essential tool for visualizing NPS data, but many businesses find it difficult to create dashboards that are both comprehensive and easy to navigate.
Solution: Invest in user-friendly dashboard tools that allow for drag-and-drop features and customization. Choose tools that enable you to filter NPS data by customer segments, product categories, or time periods.
Example: A local online retailer in Arizona uses a flexible dashboard tool that allows them to visualize NPS data alongside real-time website analytics. This gives them a clear picture of how site changes impact customer satisfaction and loyalty.
Challenge 8: Aligning Teams with NPS Insights
One of the biggest hurdles in leveraging NPS question format data effectively is ensuring that the insights gathered are shared across relevant teams in the organization.
Solution: Create a collaborative approach to NPS analysis by integrating dashboard tools with team communication platforms. This ensures that customer feedback is accessible to all teams, from marketing to customer service.
Example: A local tech startup in Seattle uses Slack to automatically share NPS updates across their teams. This transparency fosters cross-functional collaboration, enabling customer service to address issues while marketing fine-tunes their campaigns.
Challenge 9: Using NPS for Targeted Campaigns
While NPS gives you an overview of customer sentiment, using this data to launch targeted campaigns can be difficult without proper segmentation.
Solution: Segment your customer base according to their NPS scores (e.g., promoters, passives, detractors) and create tailored campaigns that address each group’s unique needs.
Example: A local restaurant uses their NPS data to send personalized offers to promoters, asking them to refer friends in exchange for a free meal, while sending exclusive discount offers to detractors to encourage them to return.
Challenge 10: Ensuring Data Accuracy
The accuracy of your NPS data is critical for making informed decisions. However, survey fatigue and poorly executed surveys can skew results.
Solution: Regularly test and refine your survey method to ensure accuracy. Keep surveys short and to the point to avoid overwhelming your customers.
Example: A small brewery in Colorado reduced their NPS survey length from 10 questions to 3, focusing on the most critical areas of customer experience. This led to a 40% increase in response accuracy and actionable insights.
Conclusion: Embracing NPS and Flexible Dashboards for Business Success
The power of NPS question format combined with flexible dashboards lies in its ability to provide businesses with real-time, actionable insights. For local businesses, this can mean better customer service, more targeted marketing, and ultimately, higher customer loyalty. However, as with any tool, there are challenges to overcome. By addressing these issues—whether it’s ensuring data accuracy, segmenting customer feedback, or integrating flexible dashboards—you can unlock the true potential of NPS and turn customer insights into growth. As we look to the future, how can local businesses continue to innovate with these tools to stay ahead of the competition? How will community support play a role in the widespread adoption of data-driven decision-making?